Effect of gestational diabetes mellitus on maternal thyroid function and body mass index
Abnormal thyroid function and glucose tolerance have been both reported during pregnancy1–3. It was hypothesized that thyroid hormones gradually increase during the first trimester, but decrease gradually over the rest of pregnancy4–6. The steady rise of human chorionic gonadotropin (hCG) hormone during the first trimester was claimed to induce follicular thyroid cells to release of tri-iodothyronine (T3) and thyroxine (T4)7, which negatively feedback on thyroid-stimulating hormone (TSH)8. During the second and third trimesters, TSH increases while T3 and T4 decrease following hCG withdrawal. Lower levels of free T3 (FT3) and T4 (FT4) over the last two thirds of pregnancy can also be explained by high thyroid hormones transport proteins concentrations induced by placental estrogens9. Alternatively, higher levels of diabetogenic hormones, reduced physical activity, decreased energy expenditure, increased carbohydrate consumption, lack of adequate sleep and other stresses during gestation increase insulin requirements of pregnant women3. Increased insulin requirement enhances development of gestational diabetes mellitus (GDM) in susceptible pregnant women e.g.obese women10, and those with dysfunctional pancreatic β-cells11 or insulin resistance12.
Weight gain is common among subjects with insulin resistance13 as well as those with hypothyroidism14. During pregnancy, the degree of insulin resistance seems to influence levels of thyroid hormones15 and pattern of change in maternal body mass index (BMI)16. In contrast to overt cases of thyroid disorders, the exact influences of T3 and T4 on BMI are ill-defined in euthyroid pregnant women17–20. According to Ashoor et al.,18, FT4 decreased while FT3 increased with higher BMI scores. Although paradoxical effects of FT3 and FT4 on maternal weight were also demonstrated in other reports17,19, some studies failed to reproduce these findings20. The euthyroid subjects studied by Milionis et al., did not show association between BMI and FT3 or FT4. However, the same study showed significant positive correlations between BMI and total T3 (TT3) as well as between BMI and total T4 (TT4) in females, but not males20. The present study aimed to investigate the effects of GDM on the maternal thyroid function and BMI. In addition, correlations between BMI, FT3 and FT4 were assessed to clarify how thyroid hormones affect maternal weight during pregnancy.
Methods
A case- control study was conducted in Saad Abualila Hospital, Khartoum, Sudan from June to August 2015. Pregnant women with singleton pregnancies who attended the hospital antenatal screening for diabetes mellitus were approached to participate in the study. After signing an informed consent, each pregnant woman was asked about her age, obstetric and medical profile. The weight and height were measured and BMI was calculated and expressed as weight (kg)/height (m)2. Women were excluded from the study if they were smokers, had history of hypertension and personal history of cardiovascular disease, had previous medical history of diabetes, were taking any medication (apart from iron supplementation), and had prior significant medical illnesses.
Coustan and Carpenter12 criteria were adopted for the diagnosis of gestational diabetes, by which after a 100-g oral glucose load, two or more of the following plasma values were met or exceeded: fasting 95 mg/dl, 1 h 180 mg/dl, 2 h 155 mg/dl, and 3 h 140 mg/dl. Women with normal values were included as controls.
Venous blood specimens (5 ml) were drawn from the median cubital vein and collected in vacutainer blood-collecting tubes. The tube specimens were allowed to clot and then were centrifuged for 10 min at 3,000×g to separate the serum which was stored at −20°C until analysis for thyroid hormones (TSH, free T3, and free T4) using immunoassay analyzer (AIA 360, Tosoh, Japan), following the manufacturer’s instructions. Specific anti-thyroperoxidase (anti-TPO) and anti-thyroglobulin (anti-TG) antibody profiles were analyzed using enzyme-linked immunosorbent assay (ELISA, Euroimmun, Lübeck, Germanykits).
Statistics
SPSS for Windows (version 16.0) was used for data analyses. Continue variables were checked for normality and their difference was compared between cases and controls using T-test and Mann-Whitney U, when the data were normally and not normally distributed, respectively. Spearman correlations were performed between the different variables. P < 0.05 was considered statistically significant.
Results
Table 1 shows the means (standard deviation, SD) of basic characteristics of the studied GDM patients and control group (34 women in each arm) including the age and gestational age. BMI was significantly higher in GDM patients (26.3 (2.7) Kg/m2) compared with the control group (24.3 (1.8) Kg/m2, P = 0.001).
| Vari… | Case… | |||
|---|---|---|---|---|
| Age,… | 31.8… | |||
| Pari… | 2.4(… | |||
| Gest… | 27.7… | |||
Table 1. Comparing the mean (SD) of the basic characteristics of women with GDM and controls.
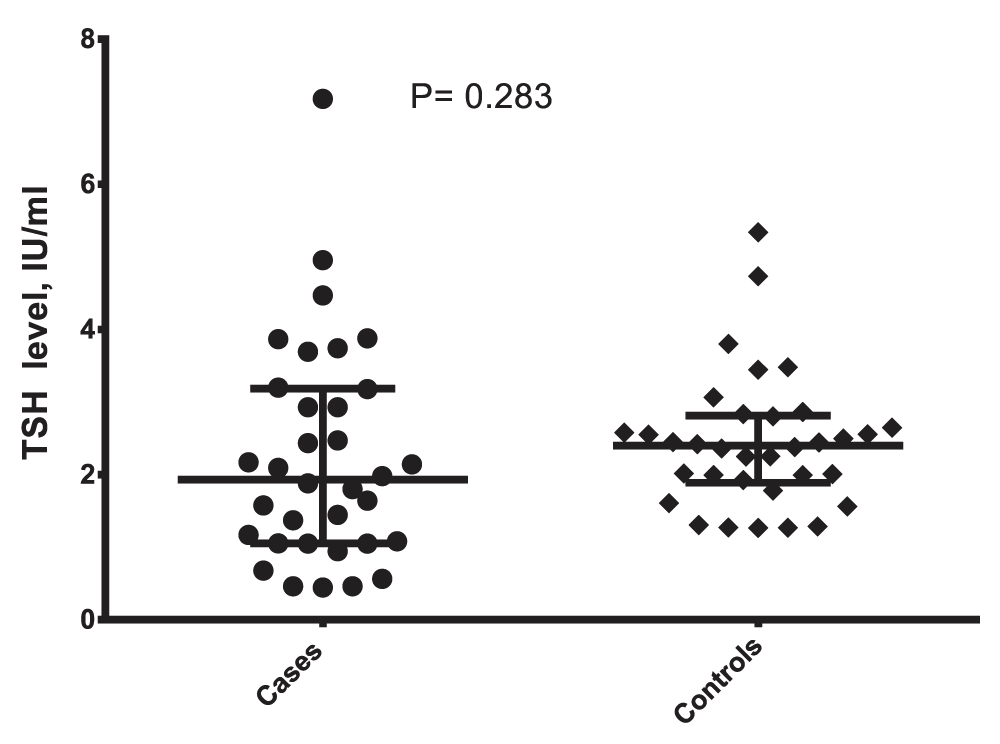
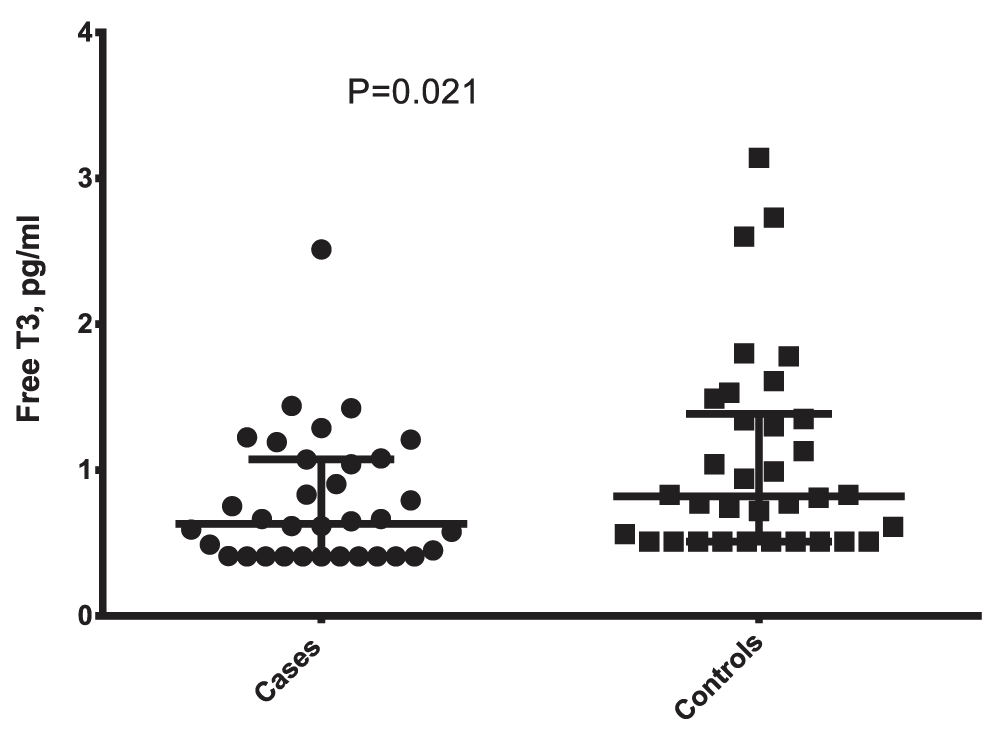
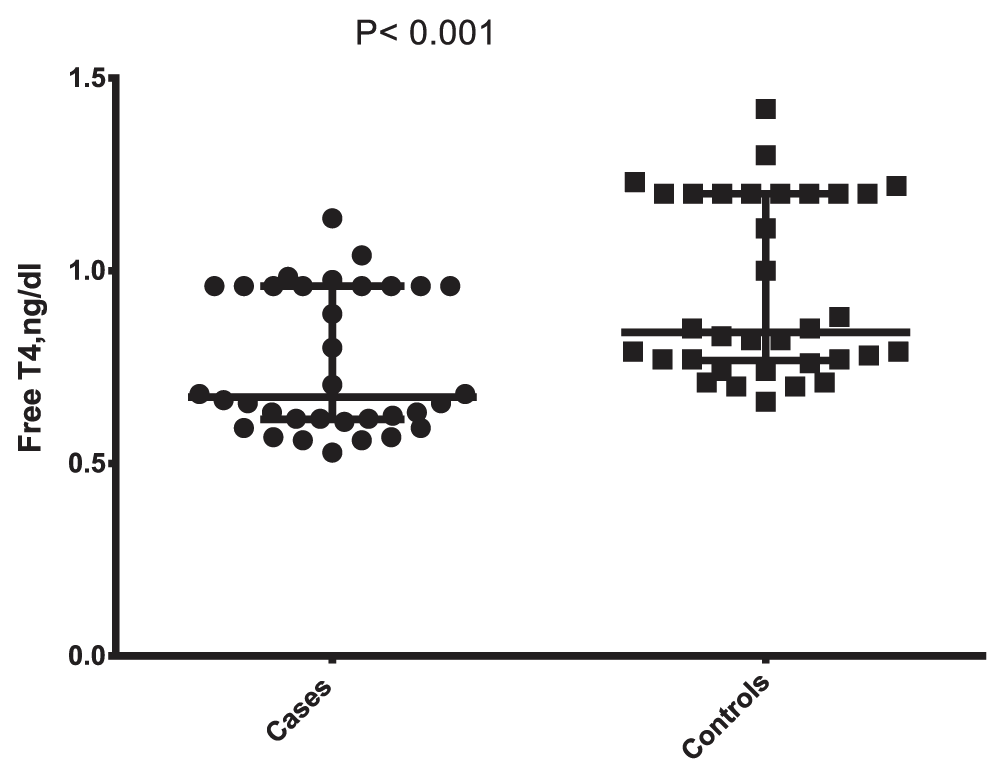
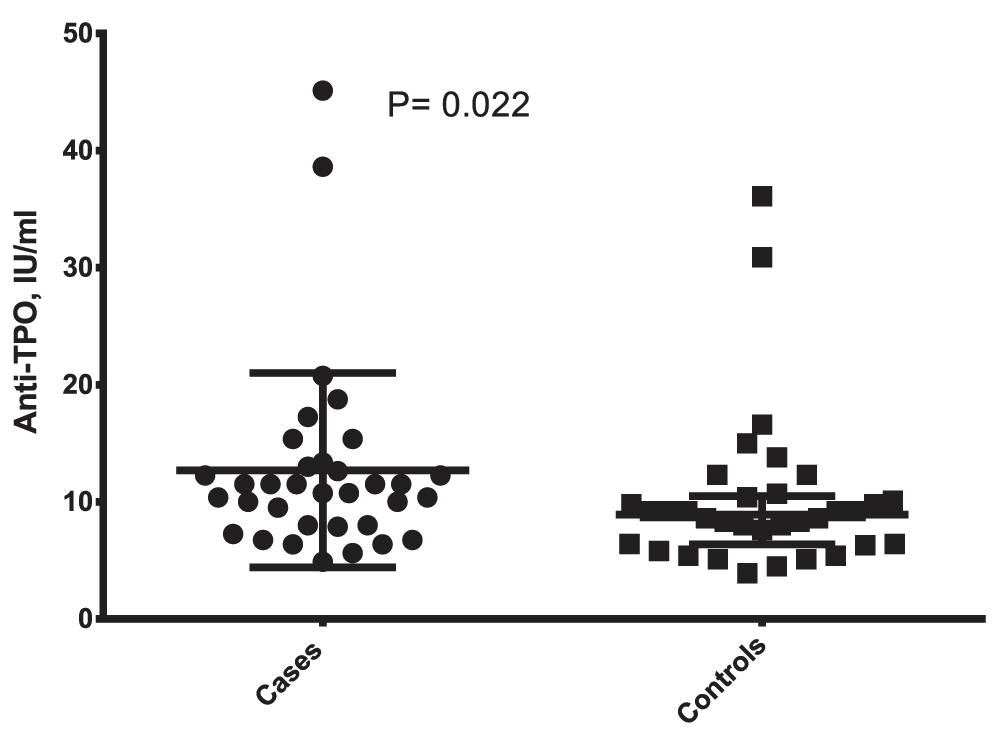
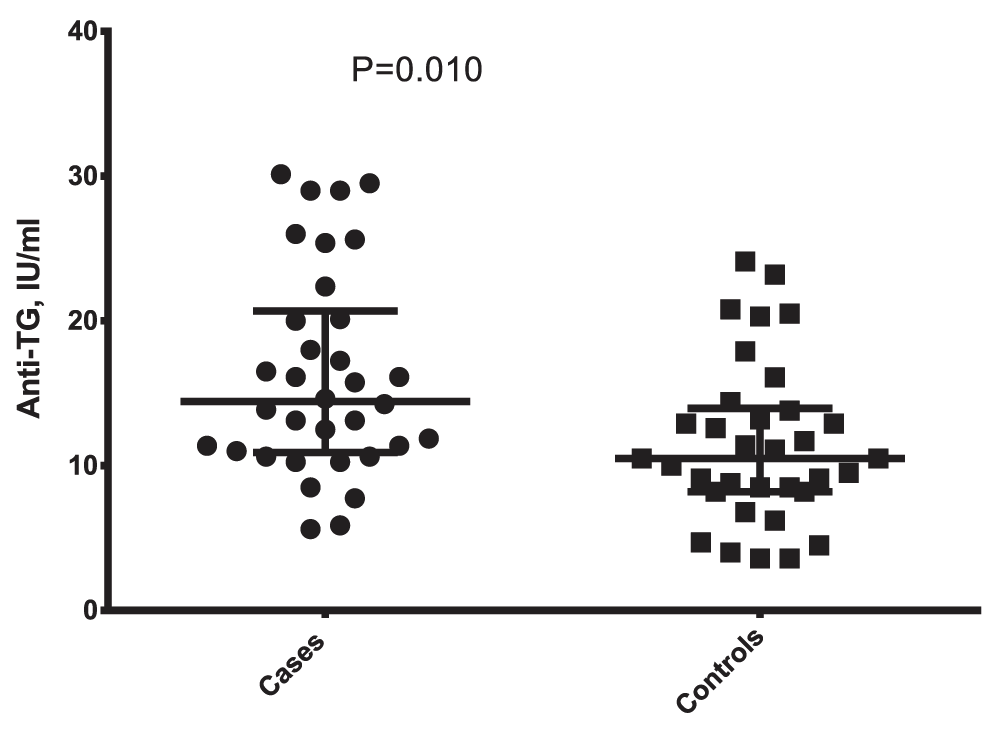
Levels of FT3 and FT4 were significantly decreased in GDM patients (0.632 (0.408–1.074) pg/ml; 0.672 (0.614–0.960) ng/dl respectively) compared with the healthy pregnant women (0.82 (0.510–1.385) pg/ml, P = 0.021; 0.840 (0.767–1.200) ng/dl, P < 0.001 respectively, Table 2). In contrast, anti-TPO and anti-TG were significantly higher in GDM patients (11.13 (7.969–13.090) IU/ml; 14.40 (10.91–20.69) IU/ml respectively) compared with the control group (8.90 (6.375–10.48 IU/ml, P = 0.022; 10.50 (8.2–13.95) IU/ml, P = 0.010 respectively), Table 2, Figure 1–Figure 5.
| Vari… | Gest… | |||
|---|---|---|---|---|
| TSH,… | 2.03… | |||
| Free… | 0.63… | |||
| Free… | 0.67… | |||
Table 2. The median (interquartile) of thyroid function and antibodies in women with gestational diabetes mellitus and healthy controls.
BMI correlated negatively with FT3 (r = – 0.375, P = 0.002) and FT4 (r = – 0.316, P = 0.009) and positively with anti-TPO (r= 0.361, P = 0.002) and anti-TG (r = 0.393, P = 0.010).
There was no significant difference in TSH levels between GDM patients (2.037 (1.053–3.323) mIU//ml) and healthy pregnant women (2.401 (1.888–2.811) mIU//ml, P = 0.283) and no significant correlation with BMI (r = – 0.094, P = 0.446), Table 3.
| Var… | BMI… | |||
|---|---|---|---|---|
| BMI | – … | |||
| TSH | –0.… | |||
| FT3 | –0.… | |||
Table 3. Correlation between BMI, thyroid hormones and thyroid antibodies.
Discussion
In accordance with the present results, previous reports demonstrated an associations between GDM and decreased thyroid hormones, increased anti-thyroid autoantibodies and higher BMI1,15,22–24. The associations between FT4, maternal weight, and GDM were recently investigated by Haddow and his group in more than 9000 singleton, euthyroid women in the FaSTER (First and Second Trimester Evaluation of Risk) trial2. An earlier report documented an inverse association between maternal weight and FT4 in the second trimester2. In a subsequent separate report on the same cohort, FT4 odds ratio for GDM was significant in the second (1.89), but not in the first (1.11) trimester1. Comparable findings were shown by Cleary-Goldman et al., when they demonstrated 1.7 odds ratio of hypothyroxinemia in GDM patients during the second trimester24. Oguz et al., confirmed decreased FT4 in 50 GDM patients compared with 60 non-GDM pregnant women; however, the mean of FT4 levels remained within the normal reference range in both groups15. Cases with isolated maternal hypothyroxinemia constituted 8% and 14% of GDM patients during the second and third trimesters respectively; however, similar cases were absent in the control group15. In another study, GDM patients showed lower FT4 compared to healthy pregnant women as well as those with type 1 diabetes mellitus. According to the same study, type 1 diabetic women had higher prevalence of anti-TPO compared with healthy pregnant women22.
According to the present findings, BMI correlates negatively with FT3 and FT4, but positively with anti-TPO and anti-TG antibodies. In contrast, our results failed to demonstrate significant correlation between BMI and TSH. Increased odds of hypothyroxinemia and anti-TPO positivity among pregnant women with BMI ≥ 30 kg/m2 during the first 8 weeks of gestation was reported before25. Although several previous studies failed to establish an association between BMI and TSH after 8 weeks of gestation26–28, at least one study was able to do so when these two parameters were assessed during early pregnancy25. It was hypothesized that the peak of hCG hormone towards the end of the first trimester simulates simultaneous increase of thyroid hormones and reciprocal inhibition of TSH release7,8,18. Except for a temporal fall of TSH levels by the end of first trimester, both TSH and BMI steadily increase throughout pregnancy26,27. This explains why previous studies were able to prove significant positive correlation between BMI and TSH during the early 8 weeks of gestation25, but failed to reproduce same results during hCG surge26–28. However, failure of our results as well as other studies28 to document significant correlation between TSH and BMI during later stages of pregnancy is difficult to explain on the same basis and should motivate researchers in the field to investigate for possible explanation(s).
Although the effects of thyroid hormones on body weight are easy predictable in cases with hypo- and hyperthyroidism, the influences of T3 and T4 on BMI are ill-defined in cases of euthyroidism26–28. The inverse relationship between FT4 and BMI demonstrated with the present results agreed with several previous reports17–19, but not others20. Likewise, the association between FT3 and BMI is a more contentious issue18,20. In a prospective cohort aimed to establish reference intervals of thyroid hormone concentrations among Finnish pregnant women, FT4 decreased while FT3 increased with higher BMI scores17. Same finding were reproduced by Ashoor et al., while assessing thyroid function before the start of the second trimester18. The paradoxical effects of FT3 and FT4 on maternal weight were further supported by Bassols et al., when they demonstrated significant direct association between FT3/FT4 ratio and BMI19. In contrast, a Greek study in euthyroid subjects failed to demonstrate the association between BMI and FT3 or FT4. The same study showed significant positive correlations between BMI and TT3 as well as between BMI and TT4 in females, but not males20. A possible explanation for different patterns of association between T3, T4 and BMI in previous reports is likely because of failure to adjust for confounders like caloric intake29,30. For example, conversion of T4 to T3 peripheral deiodinases is depressed in cases with caloric deprivation29 and enhanced with overfeeding30. This may explain the reciprocal effects of FT3 and FT4 and consequently the direct association between the FT3/FT4 ratio and BMI in cases with reduced caloric intake31. In well-fed states, peripheral deiodinase activity will not be augmented and consequently BMI is expected to correlate positively with thyroid hormones levels20. In conditions where FT3 and FT4 are below expected, increased TSH enhances leptin release and consequently BMI32. This may explain why FT3 and FT4 may negatively correlate BMI irrespective of caloric intake.
Of note, deiodinase activity and insulin resistance were not assessed in the present study. Direct measures of deiodinase activity (e.g. hepatic deiodinase-1 mRNA) are difficult to evaluate because obtaining the required tissue samples is inconvenient. However, the T3/T4 ratio was proved to correlate well with deiodinase activity and can act as a surrogate for hepatic deiodinase-1 mRNA31. Evaluation of insulin resistance using parameters like Homeostasis Model Assessment (HOMA) in future studies will enable more clarification about the potential influence of insulin resistance on the relationship between BMI, FT3 and FT4. Another limitation of this study is that dietary composition and caloric intake were not evaluated among the studied women.
Conclusion
The present results add further evidence for decreased free thyroid hormones, increased anti-thyroid autoantibodies and higher BMI in patients with GDM compared to healthy pregnant women. BMI correlates positively with FT3 and FT4, negatively with anti-TPO and anti-TG antibodies, but failed to demonstrate significant association with TSH. Further studies that also evaluate deiodinase activity, caloric intake and indictors of insulin resistance are desirable for better understanding for the relationship between BMI, FT3 and FT4 in patients with GDM.
Consent
Written informed consent to participate in the study and publish clinical details was obtained by the participants.
Data availability
F1000Research: Dataset 1. Raw data for effect of gestational diabetes mellitus on maternal thyroid function and body mass index, 10.5256/f1000research.9084.d12759933.


Comments
Post a Comment